
Description
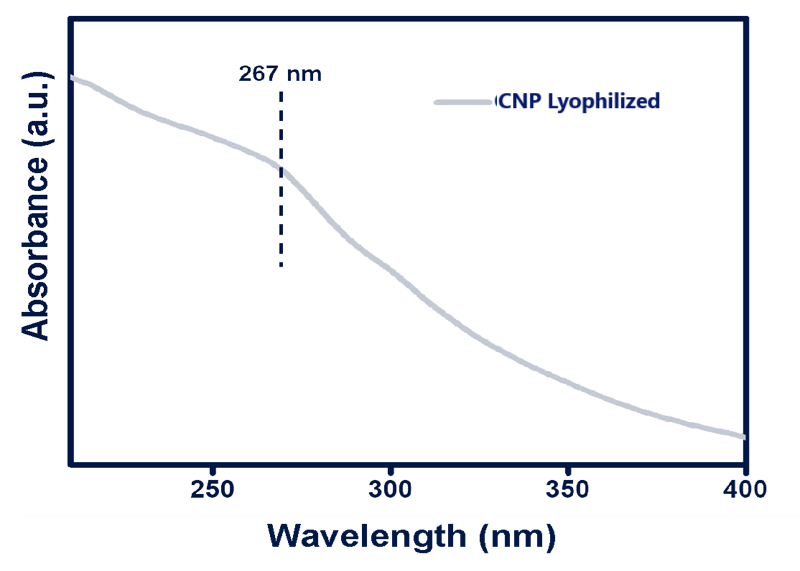
The image shows an absorption spectrum for a lyophilized sample of carbon nanoparticles (CNP). The absorbance is plotted on the y-axis in arbitrary units (a.u.), while the wavelength (in nanometers) is on the x-axis, ranging from 200 to 400 nm. There is a notable peak or key transition indicated at 267 nm, suggesting strong absorbance at this wavelength.
Absorption Spectra
![]() Represents how much light a substance absorbs at different wavelengths.
Represents how much light a substance absorbs at different wavelengths.
![]() Peaks in the spectrum indicate wavelengths where the substance absorbs the most.
Peaks in the spectrum indicate wavelengths where the substance absorbs the most.
![]() The shape and position of the spectrum are related to the electronic transitions in the material.
The shape and position of the spectrum are related to the electronic transitions in the material.