
Description
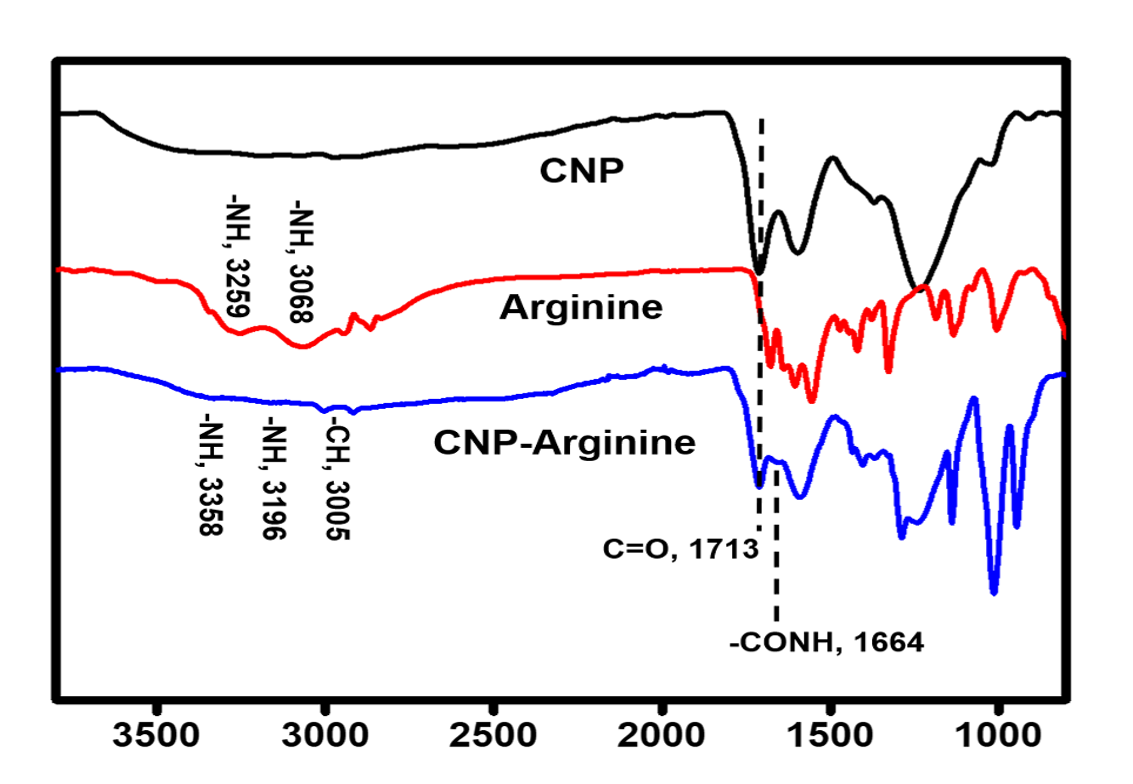
The image shows an infrared (IR) spectrum obtained via Attenuated Total Reflectance (ATR) spectroscopy, displaying two distinct plots in red and blue, representing different samples or conditions of CNP (possibly Cationic Nanoparticles) and Arginine. The peaks and valleys in the spectrum correspond to specific molecular vibrations that can be analyzed to understand the chemical interactions between the components.
ATR-IR of CNP – Arginine:
![]() ATR-IR is used to analyze the surface chemistry of samples, particularly how CNPs interact with Arginine
ATR-IR is used to analyze the surface chemistry of samples, particularly how CNPs interact with Arginine
![]() It enables identification of functional groups based on their characteristic IR absorption peaks
It enables identification of functional groups based on their characteristic IR absorption peaks
![]() The technique is effective for analyzing thin films, powders, and biological samples with minimal sample preparation
The technique is effective for analyzing thin films, powders, and biological samples with minimal sample preparation