
Description
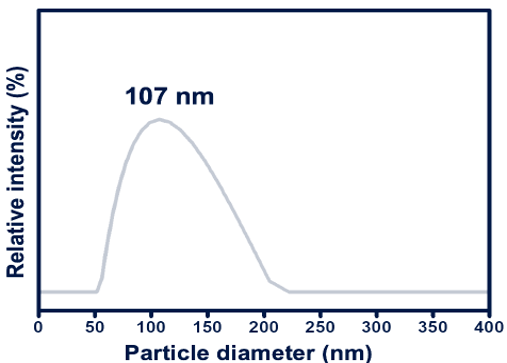
The images you have provided are related to the particle size distribution of a sample, possibly obtained using Dynamic Light Scattering (DLS). DLS is a common technique used to determine the size distribution of particles in a sample by analyzing fluctuations in scattered light.
In the first image, the peak at 107 nm suggests the dominant size of the particles in the sample, with the relative intensity (%) indicating how much of the scattering intensity is associated with particles of that size.
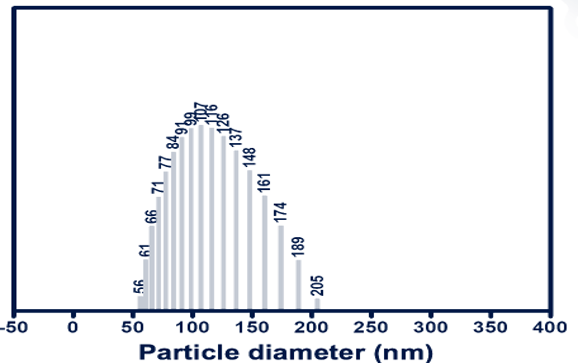
In the second image, the distribution seems more detailed, showing various particle sizes with their respective values. This distribution graph may represent a histogram or a more refined analysis of particle size, with values ranging between approximately 50 to 200 nm.
DLS of Arginine
![]() Size Distribution: DLS provides the size distribution of arginine-functionalized nanoparticles, indicating how arginine affects particle aggregation and stabilization.
Size Distribution: DLS provides the size distribution of arginine-functionalized nanoparticles, indicating how arginine affects particle aggregation and stabilization.
![]() Zeta Potential: Arginine contributes to surface charge properties, which can be reflected in zeta potential measurements, influencing the colloidal stability of particles in solution.
Zeta Potential: Arginine contributes to surface charge properties, which can be reflected in zeta potential measurements, influencing the colloidal stability of particles in solution.
![]() Hydrodynamic Diameter: The presence of arginine may affect the hydrodynamic diameter of nanoparticles, which can be larger than the actual particle size due to arginine’s interactions with the solvent.
Hydrodynamic Diameter: The presence of arginine may affect the hydrodynamic diameter of nanoparticles, which can be larger than the actual particle size due to arginine’s interactions with the solvent.