CNP – Raman Spectra

The image shown a Raman spectrum for a material, showing two prominent peaks.
Category:

Description

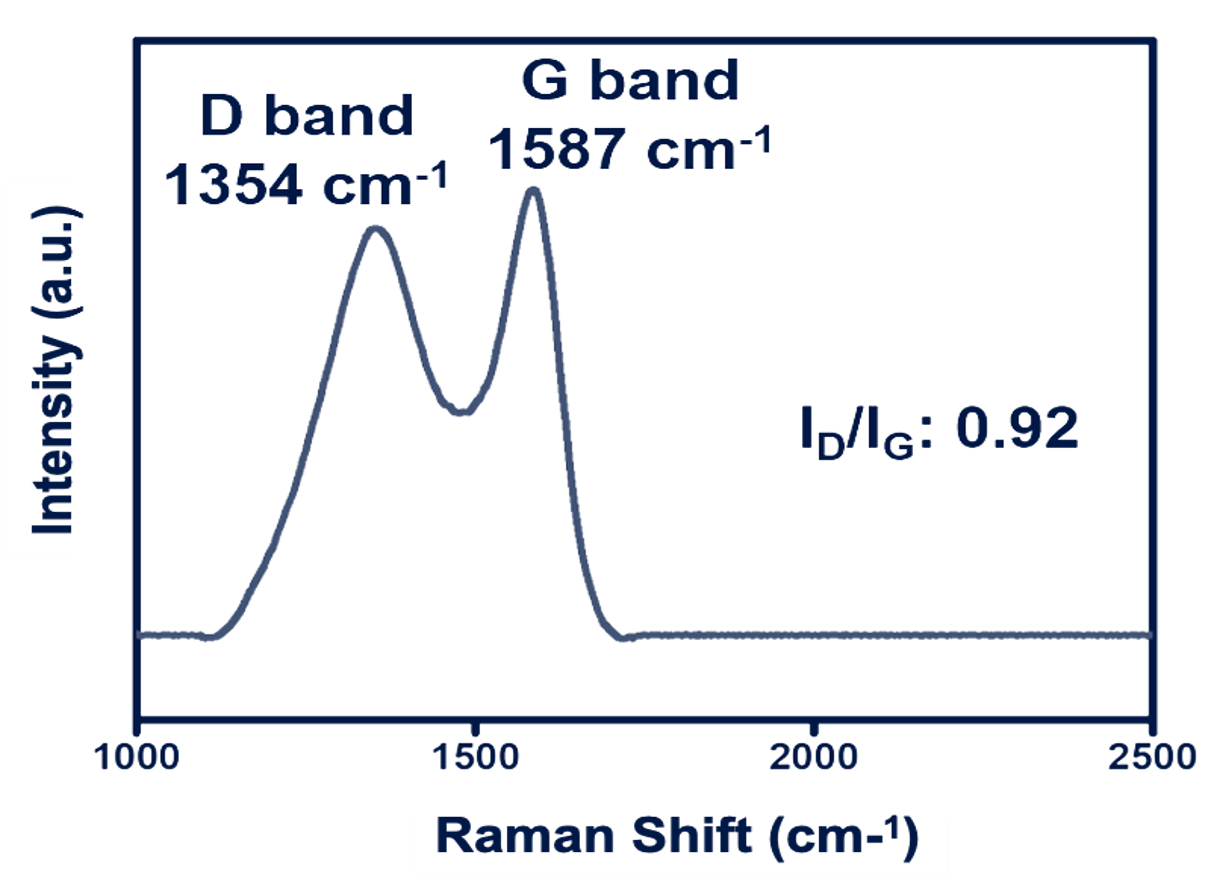
The image shown a Raman spectrum for a material, showing two prominent peaks: the D band at 1354 cm⁻¹ and the G band at 1587 cm⁻¹. The ratio of the intensities of the D and G bands (\(I_D/I_G\)) is 0.92, which can indicate the level of disorder or defects in the material, commonly seen in carbon-based materials like graphene or carbon nanotubes.

 Raman Spectra:
Raman spectroscopy detects vibrational modes of molecules, offering structural information.
The D band indicates disorder or defects in sp² carbon systems, while the G band is associated with graphitic materials.
The intensity ratio \(I_D/I_G\) provides insights into the degree of disorder or the quality of the material.