
Description
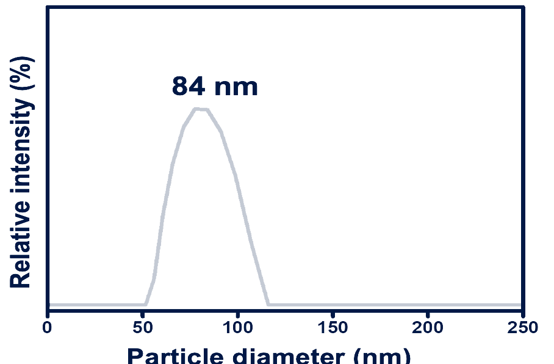
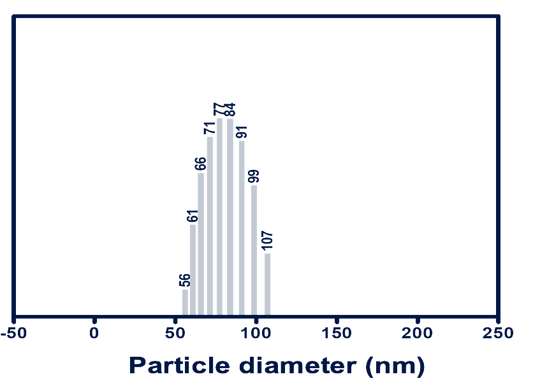
The two images represent particle size distribution data obtained through Dynamic Light Scattering (DLS) for CNP (Cationic Nanoparticles). The first bar graph shows various particle diameters ranging from 56 nm to 107 nm, indicating the distribution of particle sizes. The second plot is a line chart with a peak at 84 nm, representing the most prominent particle size in the sample with the highest relative intensity.
DLS Analysis of CNP
![]() DLS measures the size distribution of nanoparticles by analyzing the scattering of light from the particles in suspension
DLS measures the size distribution of nanoparticles by analyzing the scattering of light from the particles in suspension
![]() The line chart indicates that the majority of CNPs have a diameter of 84 nm
The line chart indicates that the majority of CNPs have a diameter of 84 nm
![]() The bar graph shows a range of particle sizes, providing insights into the polydispersity of the sample
The bar graph shows a range of particle sizes, providing insights into the polydispersity of the sample