Description
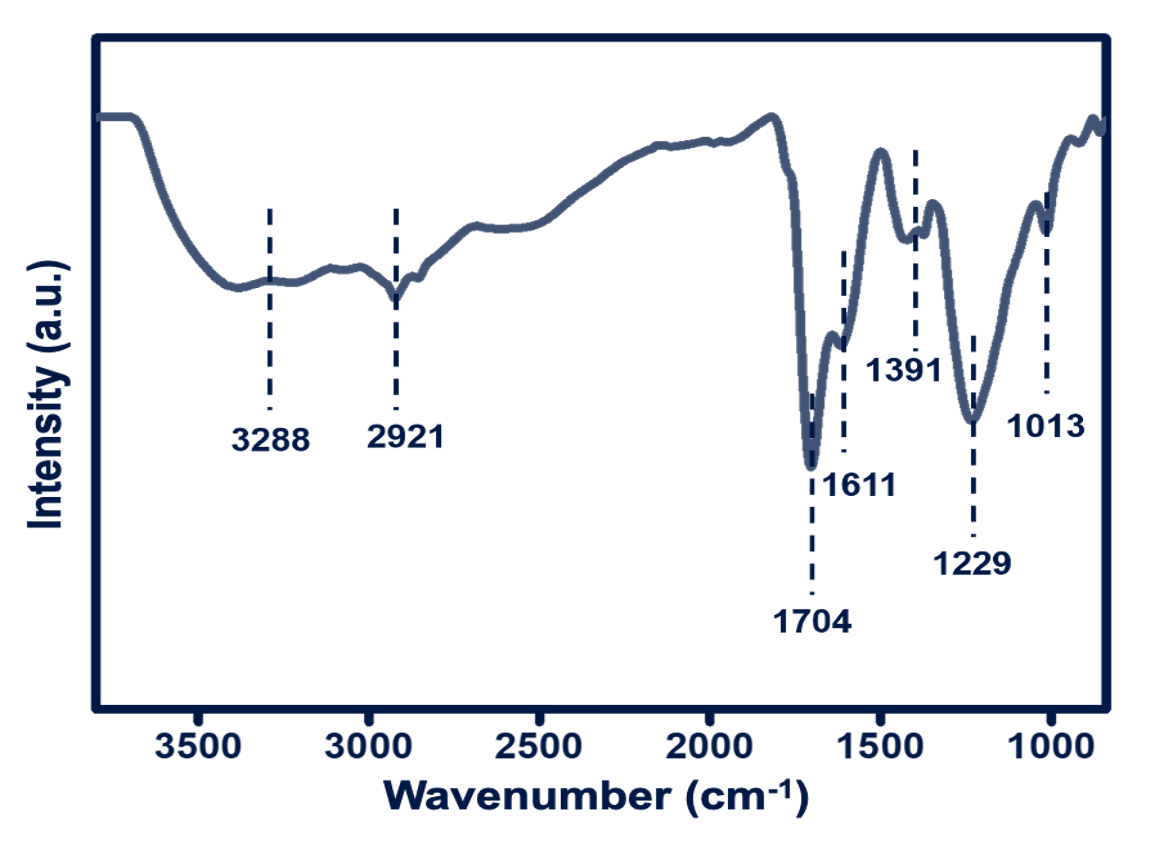
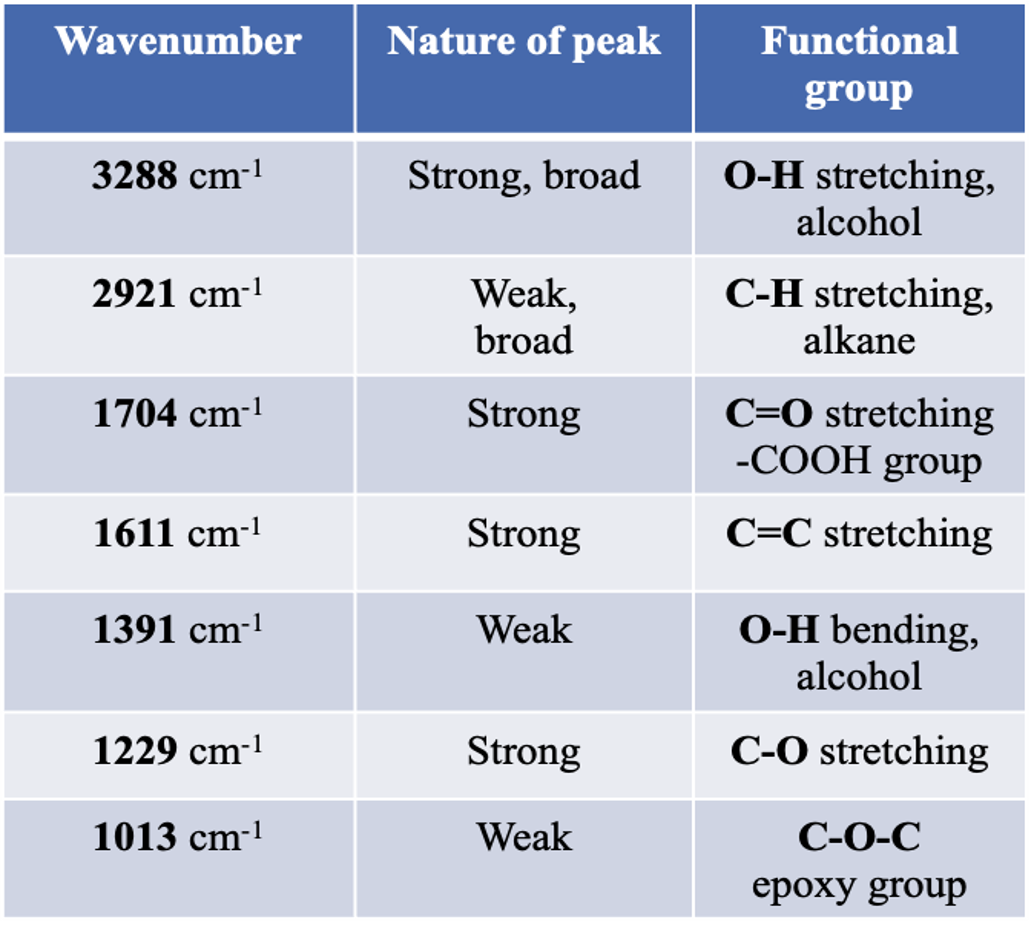
The image represents an ATR-IR (Attenuated Total Reflectance Infrared Spectroscopy) spectrum of Carbon Nanoparticles (CNP). The spectrum displays various peaks at characteristic wavenumbers, such as 3288 cm⁻¹ (O-H stretching), 2921 cm⁻¹ (C-H stretching), and 1704 cm⁻¹ (C=O stretching), which indicate the presence of different functional groups on the surface of the CNPs.
ATR-IR Spectroscopy:
Identifies surface functional groups based on vibrational frequencies
Useful for studying surface chemistry of nanoparticles and thin films
Peaks correspond to specific bond vibrations, giving insights into molecular composition

